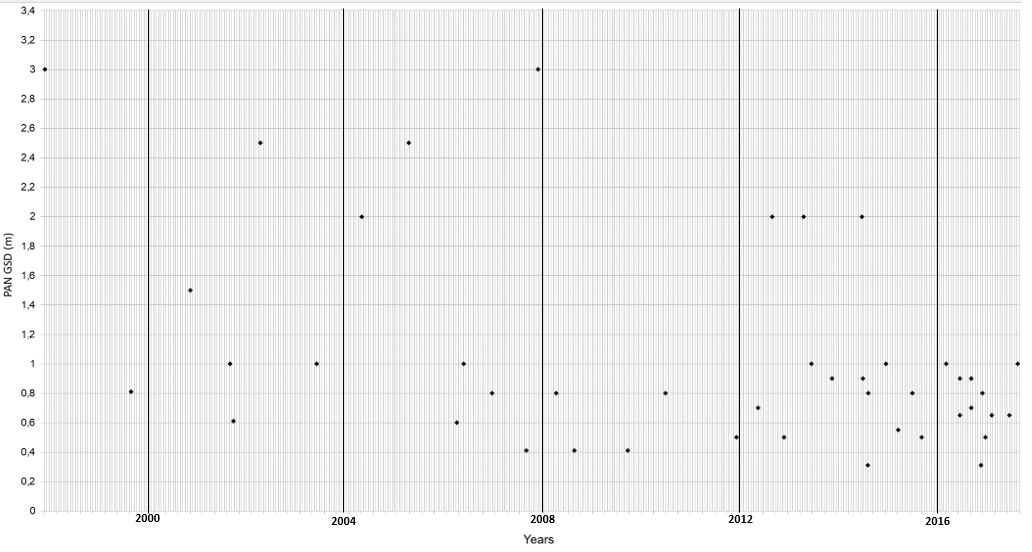
Fig. 3. HR satellites analysed in the previous chart. The date of launch, from 1997 to 2017, is located on the X axis, while the maximum Ground Sampling Distance in Panchromatic mode is on the Y axis. It can be seen how, throughout the years, the launches become more frequent and the resolution increases